AI Sales Analytics Dashboard
A comprehensive business intelligence dashboard powered by AI, featuring interactive analytics, predictive insights, customer segmentation, and intelligent chat assistance.
Project Overview
🎯 Purpose
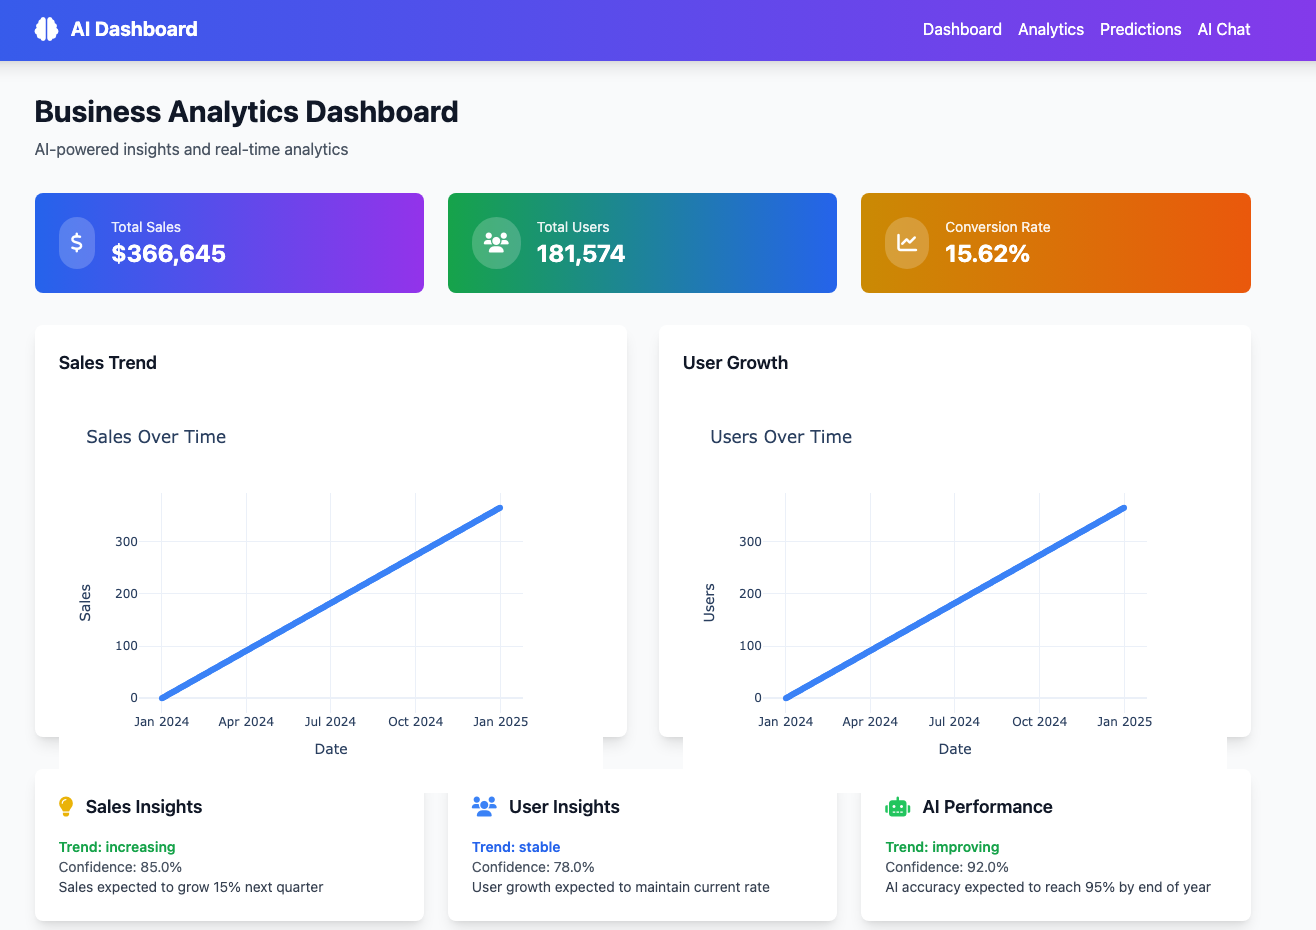
Created a comprehensive business intelligence dashboard that demonstrates advanced AI integration for sales analytics, predictive modeling, and interactive data visualization. The project showcases modern web development practices combined with machine learning capabilities.
🚀 Key Features
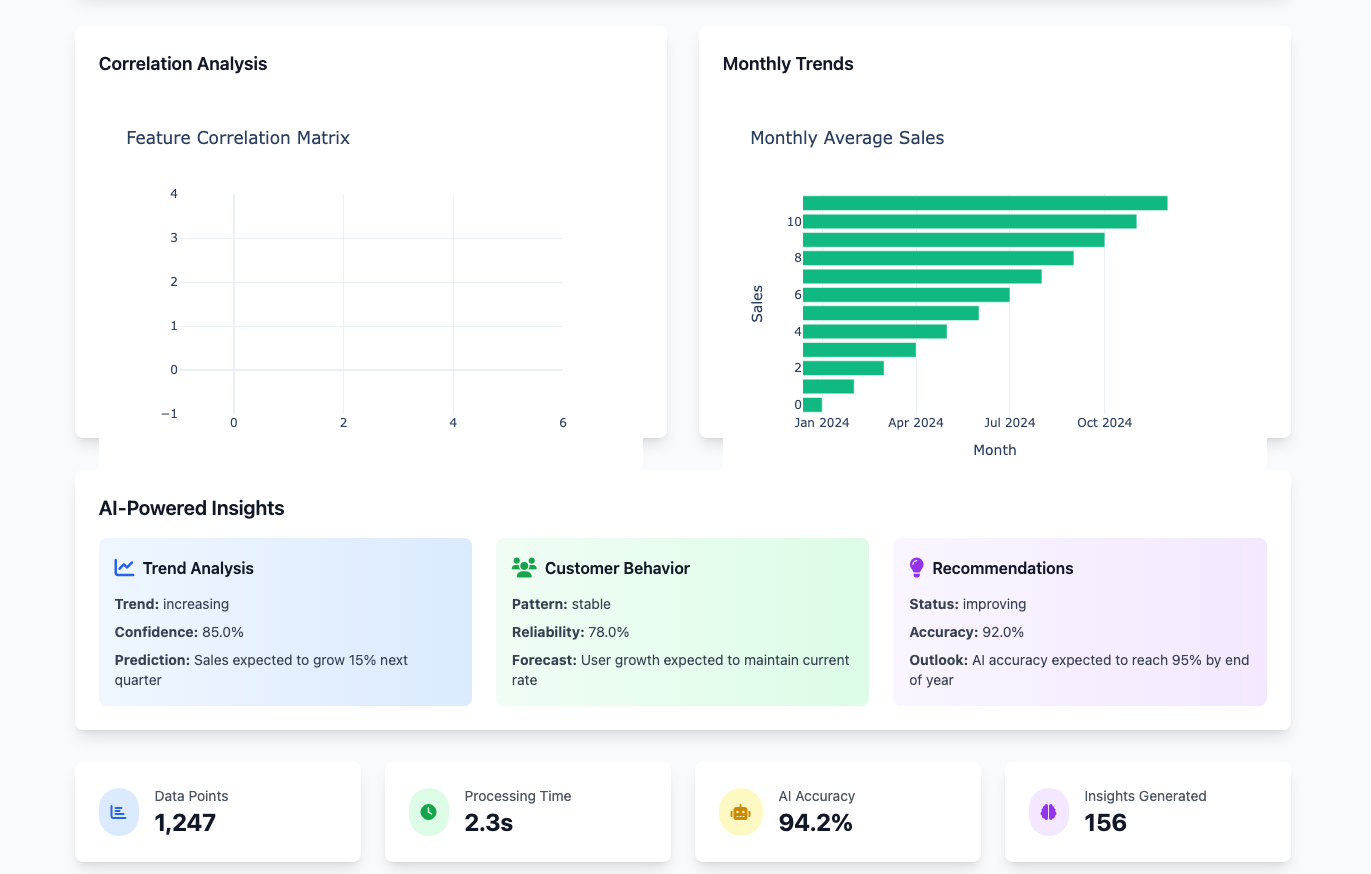
- • Interactive data visualization with Plotly charts
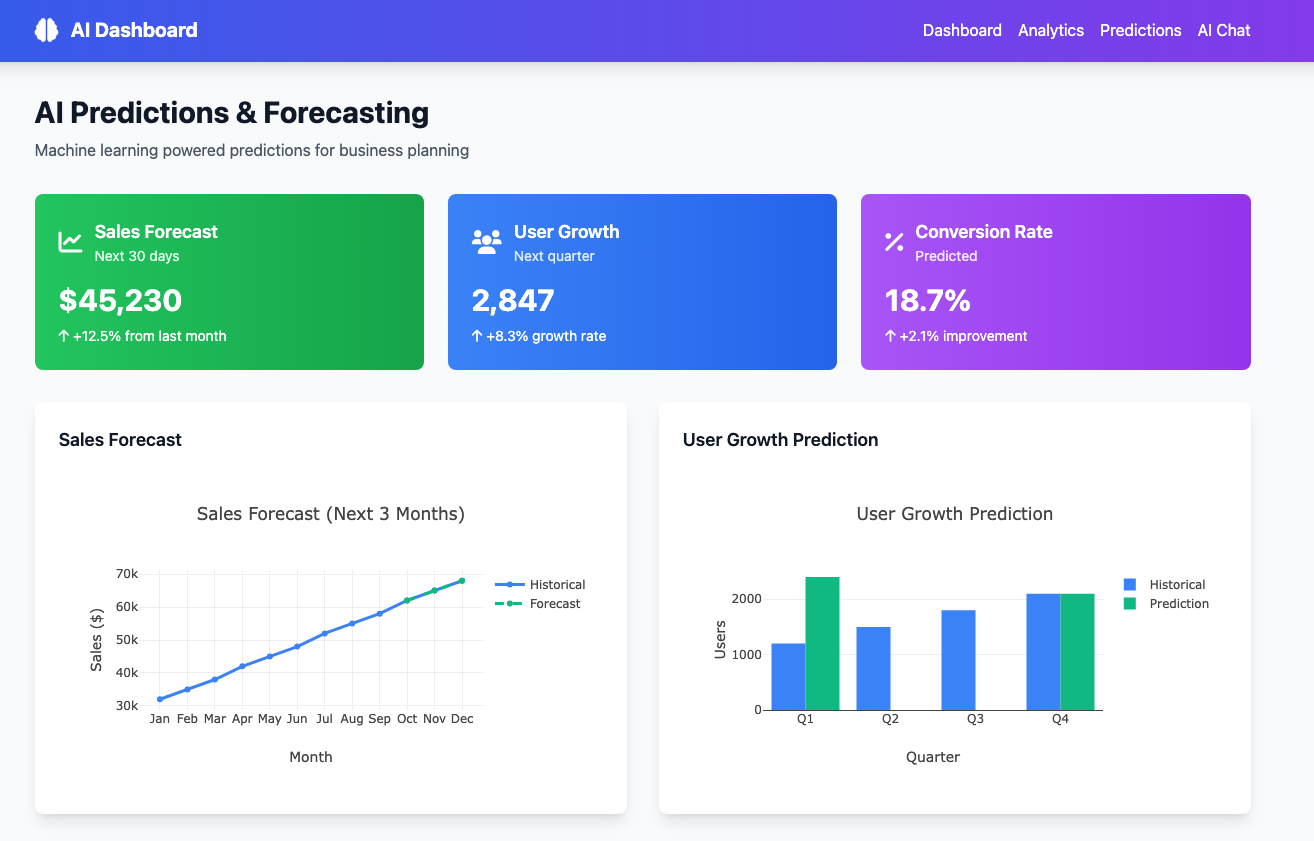
- • AI-powered predictive analytics and insights
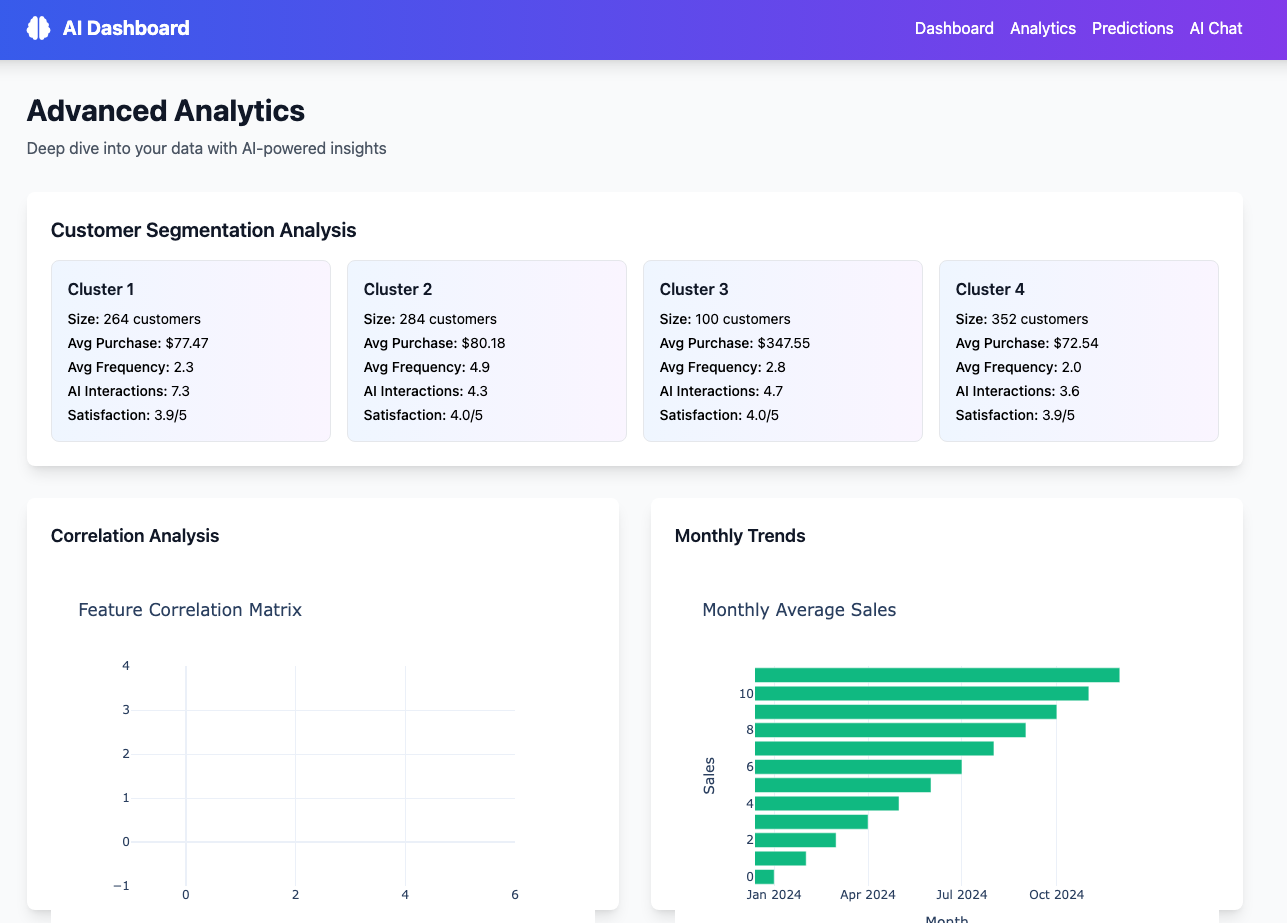
- • Customer segmentation using K-means clustering
- • Intelligent chat assistant with OpenAI integration
- • Real-time statistics and performance metrics
- • Responsive design with modern UI/UX
🛠️ Technical Implementation
- • Flask backend with RESTful API endpoints
- • Pandas for data manipulation and analysis
- • Scikit-learn for machine learning algorithms
- • Plotly.js for interactive visualizations
- • OpenAI API for intelligent chat functionality
- • TailwindCSS for responsive styling
Dashboard Screenshots
Main Dashboard Overview
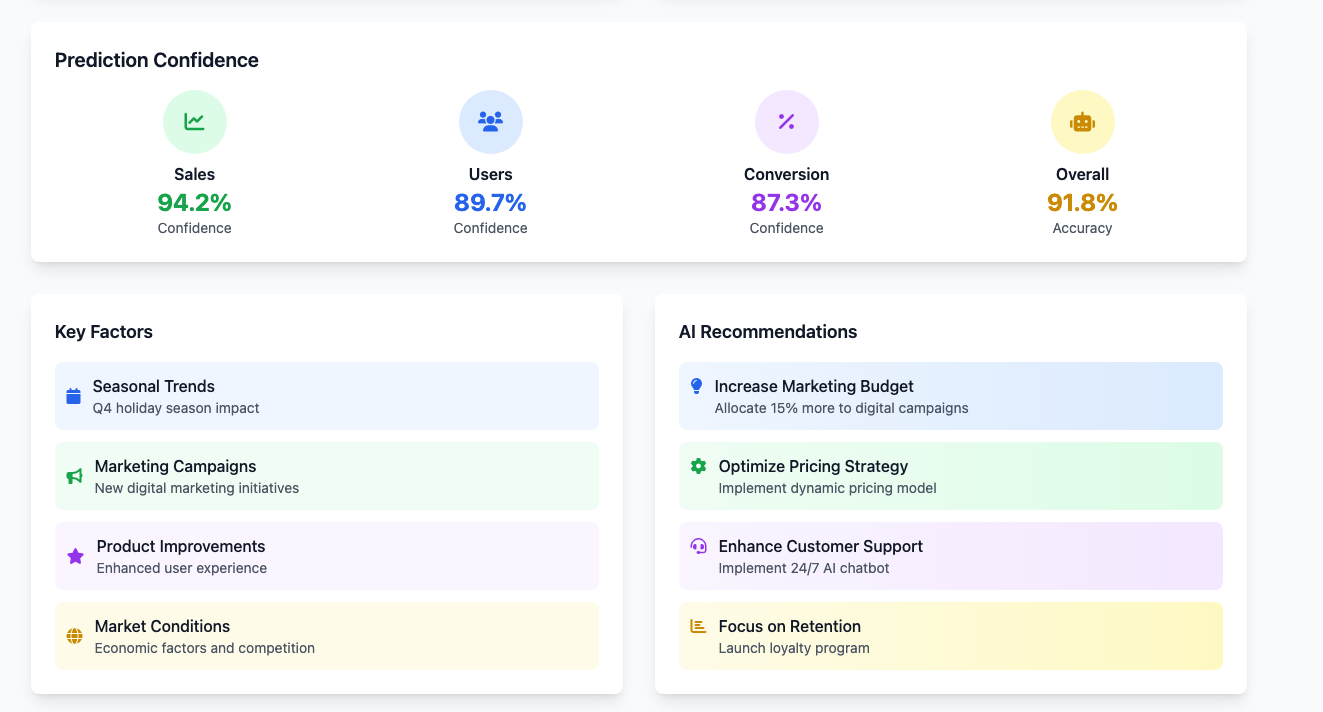
AI Predictions & Forecasting
Advanced Analytics
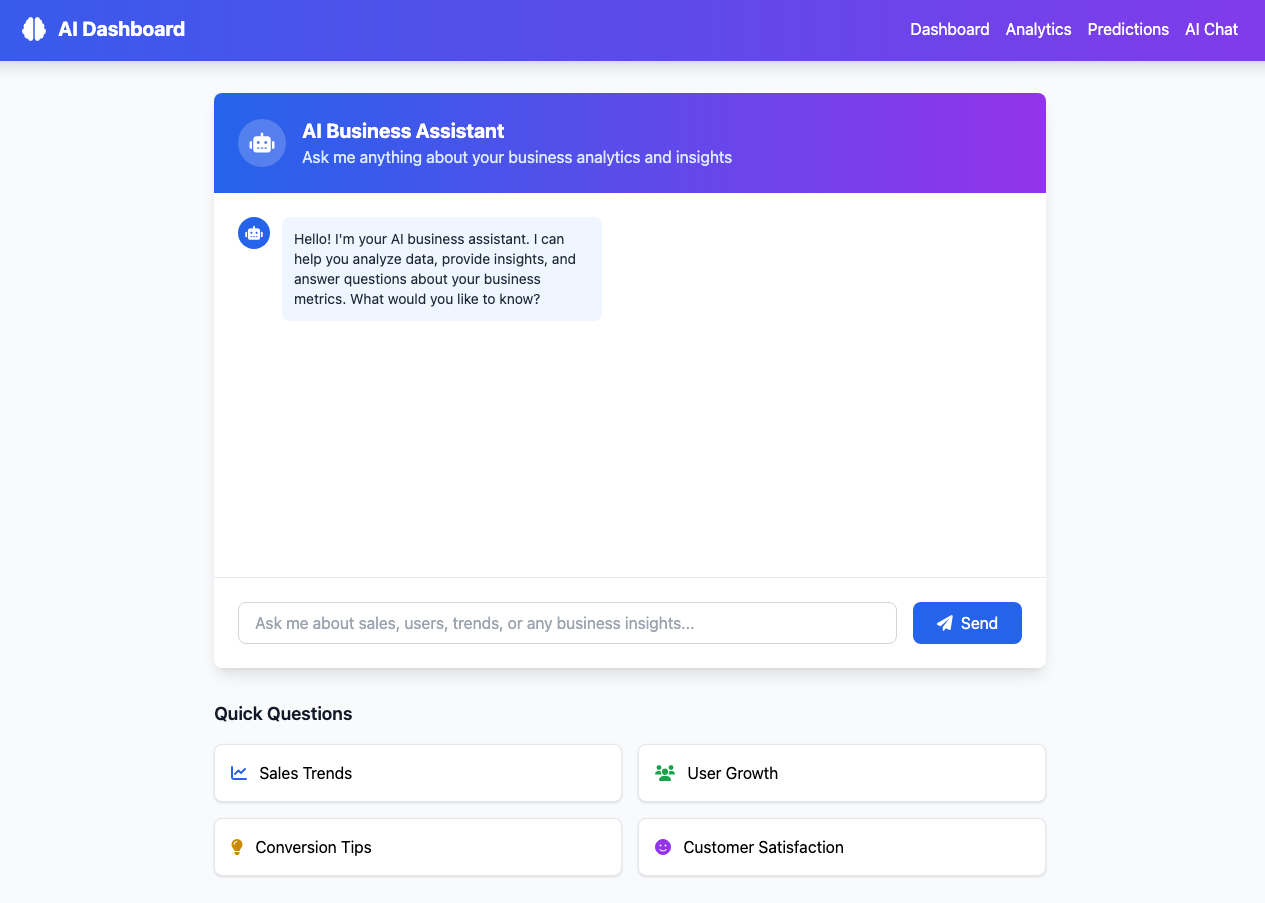
AI Chat Assistant
Interactive Charts
Complete Dashboard View
Development Process
Data Analysis
Implemented comprehensive data generation and analysis using Pandas and NumPy, creating realistic business metrics for demonstration purposes.
AI Integration
Integrated OpenAI API for intelligent chat functionality and implemented machine learning algorithms for customer segmentation and predictive analytics.
UI/UX Design
Created responsive, modern interface using TailwindCSS with interactive charts powered by Plotly.js for enhanced user experience.
Challenges & Solutions
Challenge: Real-time Data Visualization
Creating interactive, responsive charts that update dynamically with user interactions.
Solution: Implemented Plotly.js with Flask API endpoints for seamless data updates and smooth user interactions.
Challenge: AI Integration Complexity
Managing API rate limits and handling asynchronous AI responses while maintaining good UX.
Solution: Implemented proper error handling, loading states, and fallback responses for robust AI integration.
Challenge: Performance Optimization
Ensuring fast loading times with complex data processing and multiple API calls.
Solution: Optimized data structures, implemented caching strategies, and used efficient algorithms for data processing.
Future Enhancements
🔮 Planned Features
- • Real-time data streaming from external sources
- • Advanced machine learning models for better predictions
- • User authentication and role-based access control
- • Export functionality for reports and data
- • Mobile-responsive design improvements
🚀 Technical Improvements
- • Database integration for persistent data storage
- • WebSocket implementation for real-time updates
- • Docker containerization for easy deployment
- • Comprehensive testing suite implementation
- • CI/CD pipeline for automated deployments